Monitoring
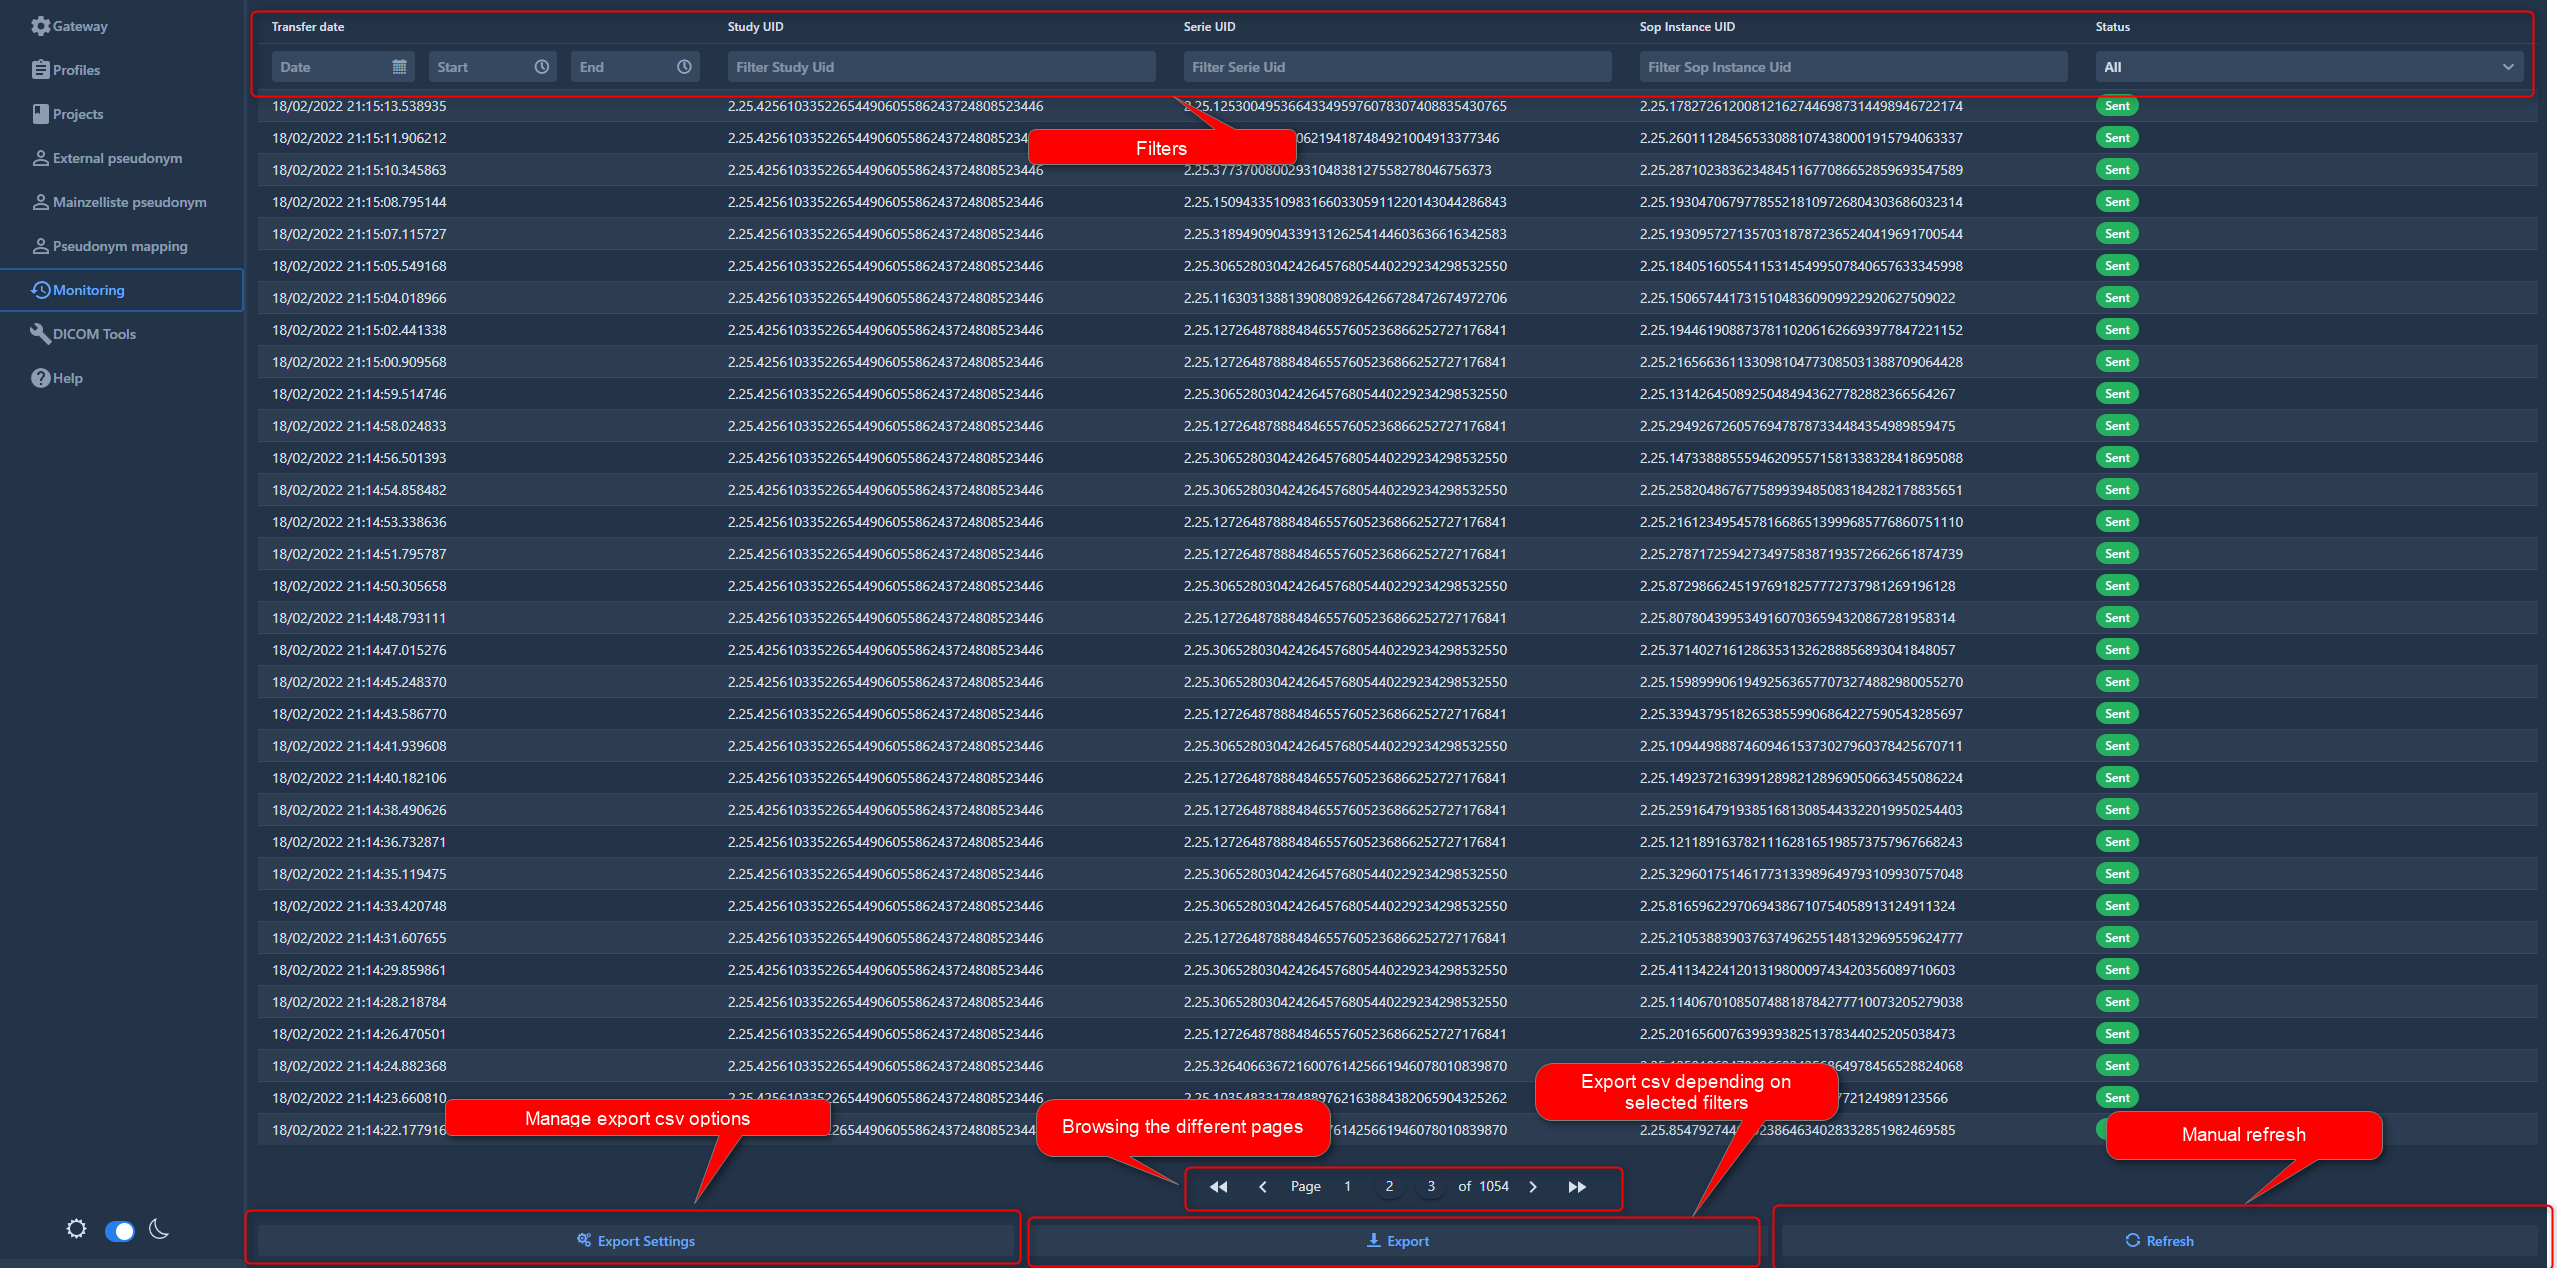
The Monitoring view allows you to track transfers in progress or view the history of recent transfers. The list is ordered chronologically, with the most recent transfers displayed first.
By default, the log retains the last 150,000 transfers. An automatic cleaning process runs to remove older entries when this limit is exceeded.
Detailed information for each transfer, including both original and de-identified attributes, can be viewed by clicking on a transfer row.
1. Filters
Filters allow you to search and narrow down the list of transfers. You can filter by:
- Date/Time: Range of the transfer.
- UIDs: Study, Series, or SOP Instance UID (matches original or de-identified values).
- Status: The outcome of the transfer (Not sent, Sent, All, Excluded, Error).
Transfer Statuses
The status of a transfer is color-coded:
- Sent (Green): The instance was successfully sent.
- Excluded (Orange): The instance was not sent due to configuration rules. This includes the SOP Class filter, destination conditions, or the use of
ExcludeInstance()in the profile. The label indicates the specific reason for exclusion. - Error (Red): The instance was not sent because an unexpected error occurred. The label indicates the error type.
2. Browsing
Use the navigation bar at the bottom of the view to browse through the pages of the transfer log.
3. Refresh
Click the refresh button to update the list with the most recent transfers.
4. Export
You can export the transfer log to a CSV file. The export function respects the currently active filters, so only the transfers displayed (or matching the criteria) will be included in the file.
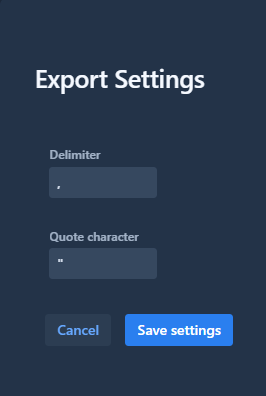
Before exporting, you can customize the CSV format:
- Delimiter: Select the character used to separate fields.
- Quote character: Select the character used to enclose fields.
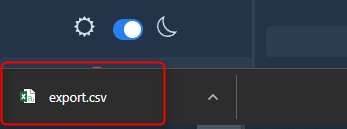
Once customized, click the export button to generate and download the CSV file.


